Free for single users
Claude Code & Codex Usage Intelligence
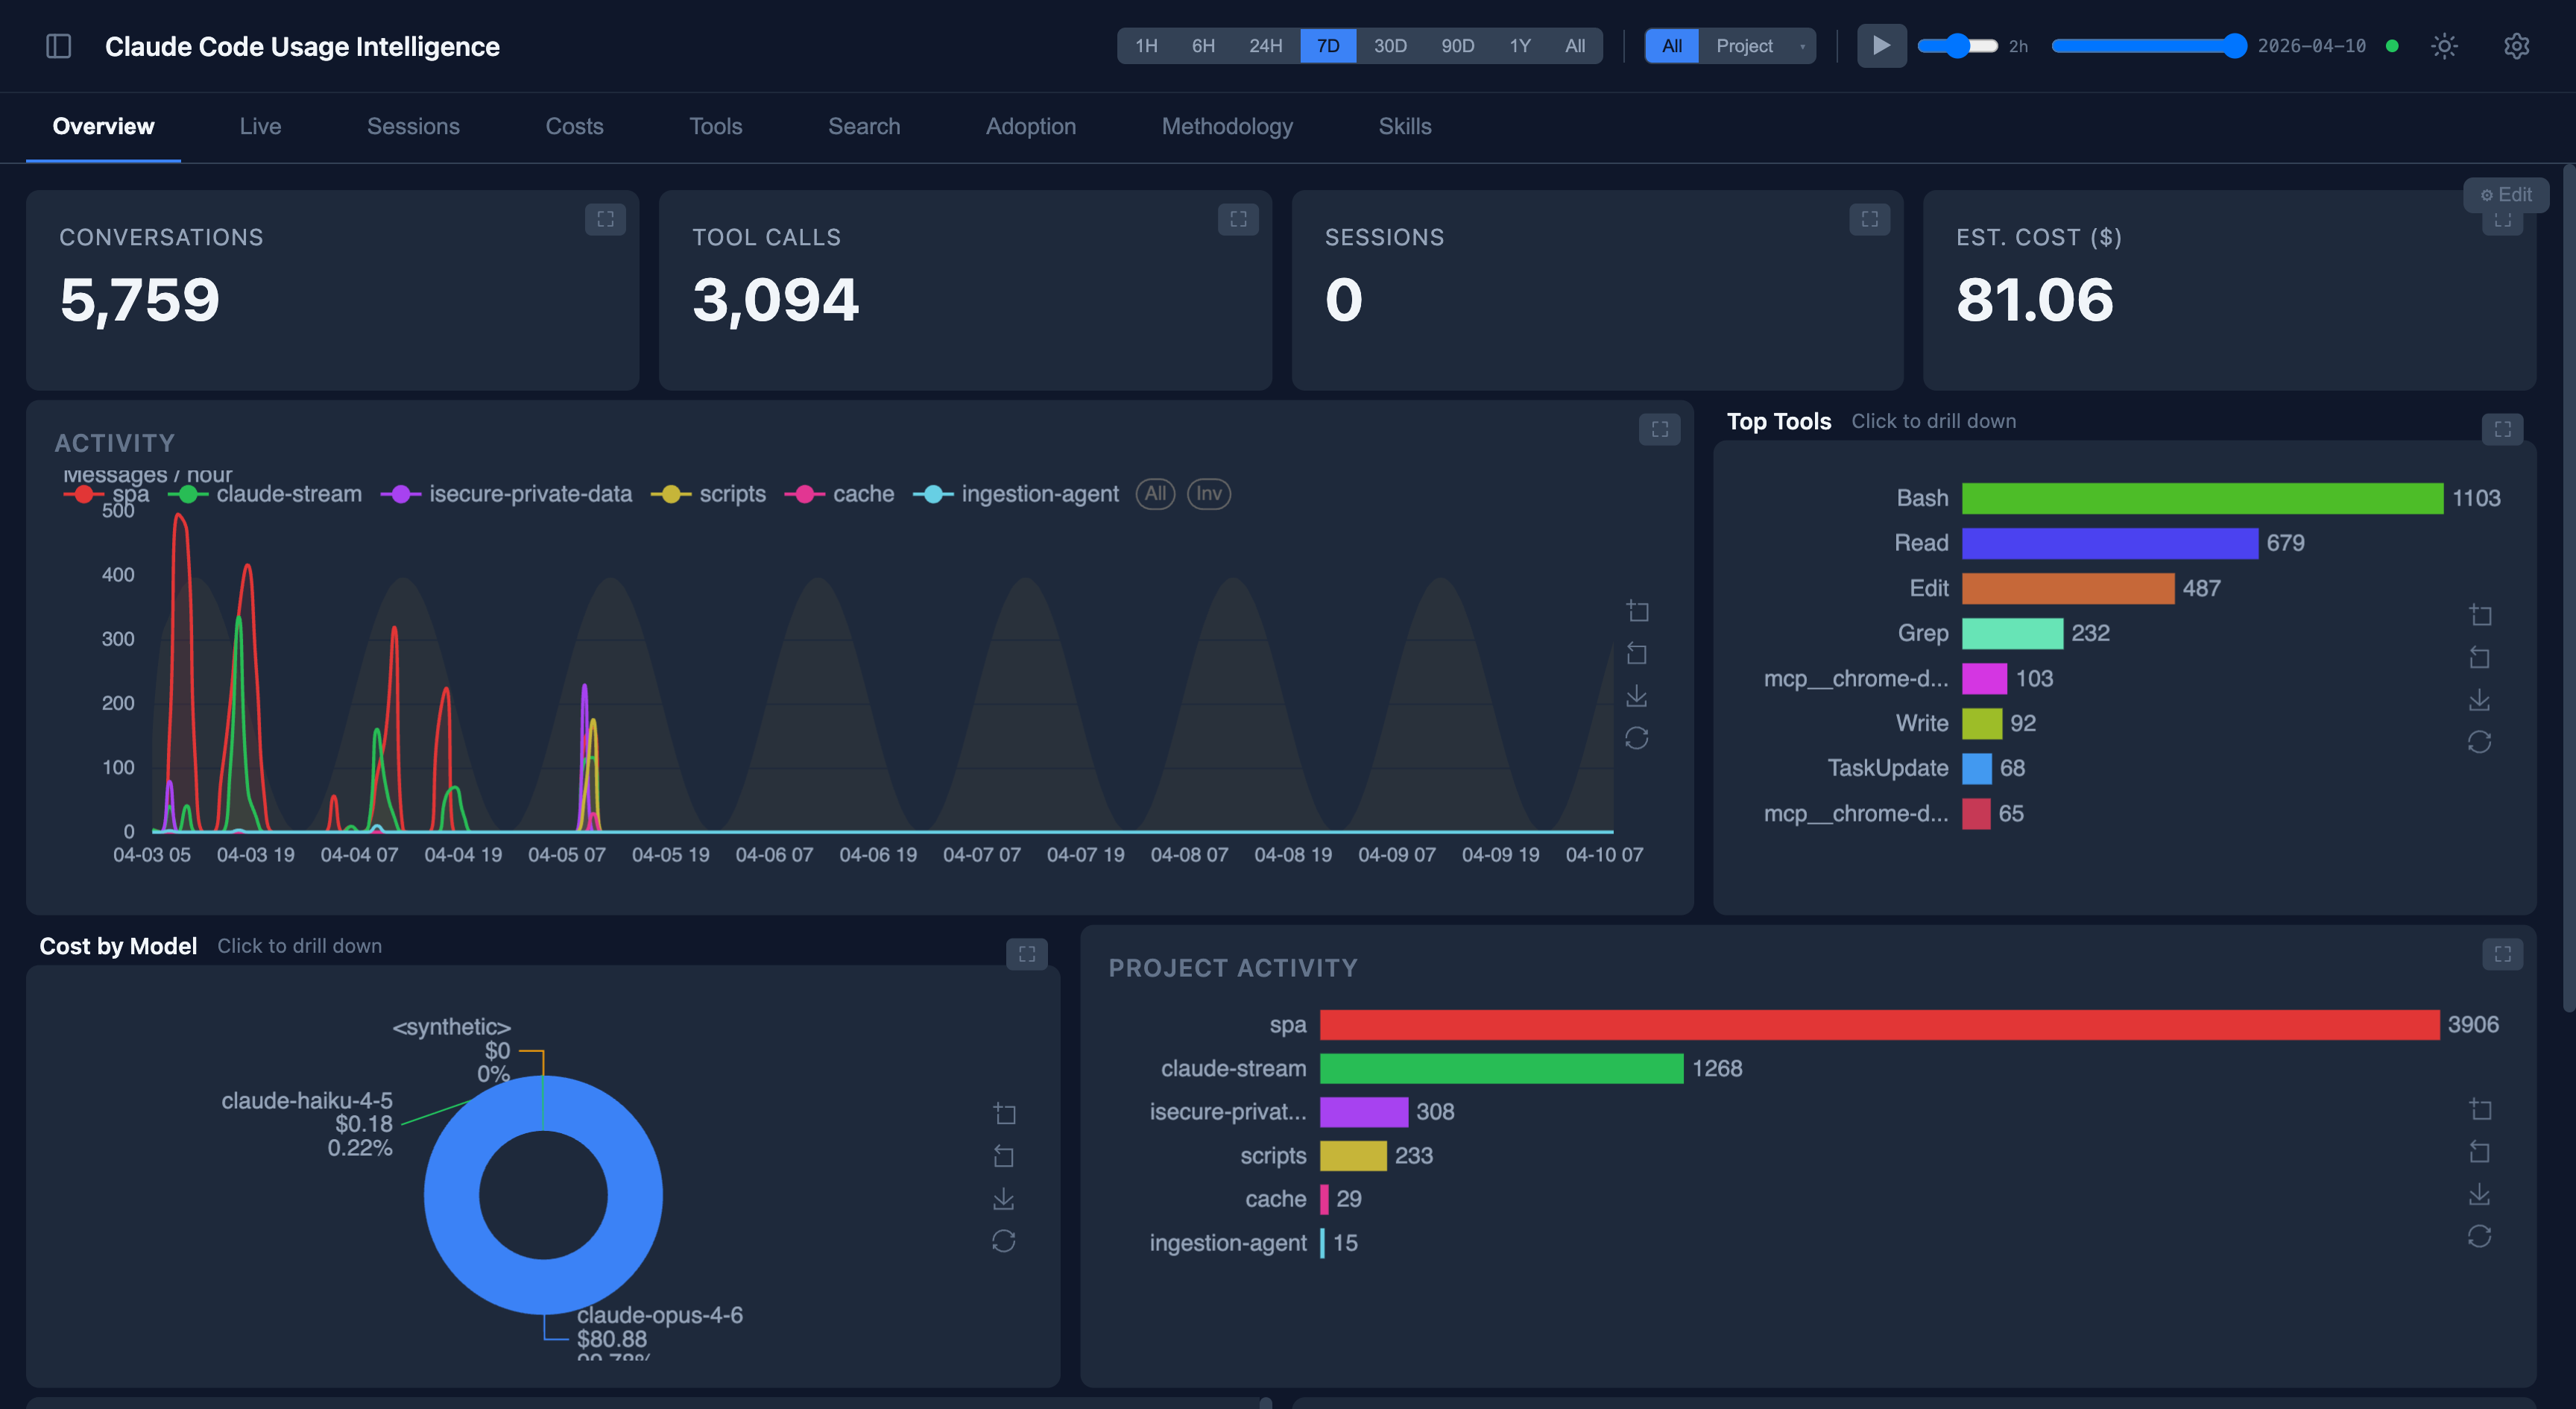
Track conversations, costs, tool usage, and team productivity across your coding agents. Desktop app with native DuckDB — your data stays local.
Track conversations, costs, tool usage, and team productivity across your coding agents. Desktop app with native DuckDB — your data stays local.
Parses your local ~/.claude/ and ~/.codex/ directories and loads them into an embedded DuckDB for instant analytics — Claude Code and OpenAI Codex side by side.
Messages per hour/day, project breakdown, day/night overlay. Drill into any project for token-level detail with dual Y-axis view.
Cost per model, per project, over time. Token breakdown with cache hit ratios. Know exactly what you're spending.
Top tools, error rates, drill-down by project. See which tools your team uses most and which ones fail.
Gantt chart of all sessions. Duration, message count, tool calls per session. See active and completed sessions.
Ask questions about your data in natural language. Claude generates SQL, creates widgets, and updates dashboards.
Drag-and-drop grid layout. Customize views, add widgets, resize charts. Built-in views with copy-on-write editing.
Single-user analytics run entirely on your machine. Connect to BoilStream for multi-user, live streaming, and shared dashboards.
Single binary. No dependencies. Auto-updates built in.